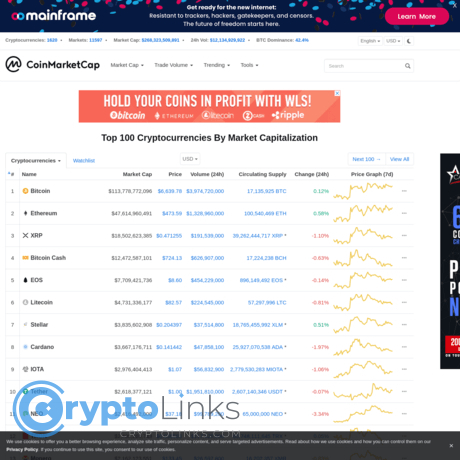
Bitcointicker

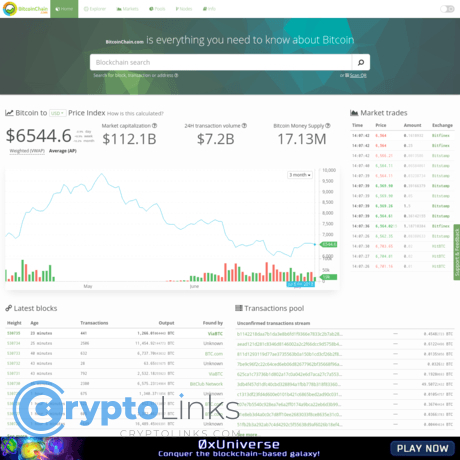
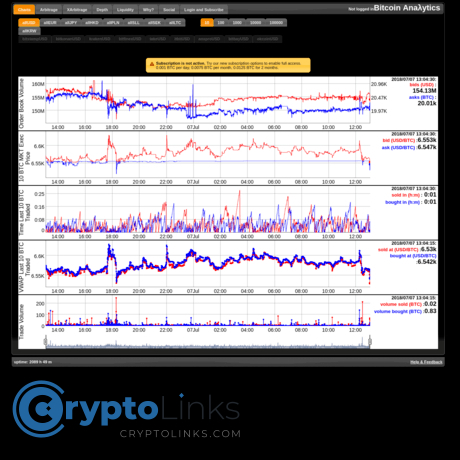
Bitcointicker is a very simple website with very complex tools. It’s all about the data here at Bitcointicker and before we get started, I want to be completely honest with you. If you do not understand how to read complex charts and extract data from them, you will be wasting your time on this website. There are no instructions and it does not explain the data in any way. With that said and hopefully all the noobs are gone, lets discuss what you can find here. Lets start with the most simple portion. The right side is an order book that is updated in real time. Here you can see all of the orders on the exchange selected and watch as they are placed and filled. Above the order book are options to choose between Bitstamp, Btoe, Bitfinex, Kraken, Coinbase, and Gemini. To the right of those options are time frame variables. The chart on the top left is kind of an automatic indicator laying chart that is displaying the price of BTC compared to the indicators you choose. The indicator choices can be found on the top of the graph by clicking graph options. You can use to display SMA, EMA, Donchian Channel, and if you want the graph to be set as candlesticks or line graph. What I’m confused about is how the moving averages are calculated as it doesn’t tell you the period they are calculated on. I would assume it is based on the timeframe chosen? I’m not sure on this one, its not made clear and there are no instructions to guide us. We can be sure that the bottom bar graphs are volume indicators and the red and green lines are the gap between the price available and the price asked for. Under that rather confusing chart, you’ll find another confusing chart! This seems to be the order spread, which indicates the price difference between what people are currently willing to pay versus what they are willing to sell.