BitcoinCity
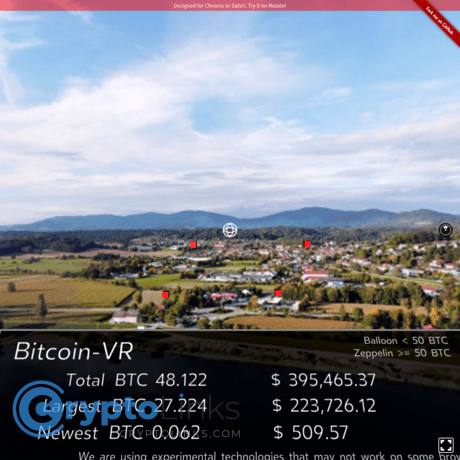
Different ideas and concepts are coming up lately depicting crypto transactions of many currencies. That of Bitcoin is the most largely spoken of and this is undoubtedly due to its increase in global recognition and market value. It's trading and investing system is a high standard and well organized. Platforms are built daily, used in the explanation of the various activities going on in the world of Bitcoin and it’s road to Blockchain. One of such platforms is bitcoincity.info This is a platform particularly structures to show the path of various bitcoin trading as they happen all around the world using building structures. Cities are erected graphically each time a bitcoin transaction is taking place as well as showing its road to the blockchain. This site uses a WebSocket API as a source of data and Isomer as a javascript graphics library. All the information given on this platform is collected from the latest bitcoin transaction, although most are unconfirmed they most times turn out to be completed. There are different city elements displaying different views and having different meanings. The ground depth or elevation, for instance, reflects transaction size in bytes. The building in itself also implies a whole lot of important transaction details. The window, as well as the roof, have their various meanings too. There is also a flag shown, a crosswalk, trees as well as limitations, all showing a particular transaction detail.