BitBonkers
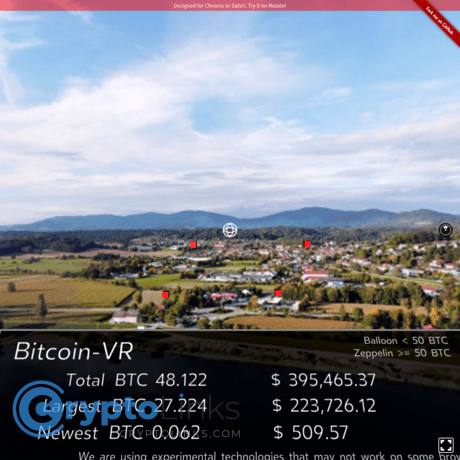
Bitcoin trading goes on and on almost always. Traders are not sleeping and enthusiasts are not also relenting, everyone is all out, buying and selling or doing one transaction or the other, trading with the biggest crypto coin of all time. This trading can be monitored on many sites though there are some sites that have been designed especially for the purpose of this. One site worthy of note in this niche is bitbonkers.com bitbonkers.com is unique in itself in the sense that, it has been designed to show how often Bitcoin trading is being done as well as the estimated and specific value of bitcoin being traded every time the transaction is going on. It has a very wonderful interface with a very simple design which shows colored balls each time a transaction is taking place. Each colored ball represents a particular value. The balls usually fall on a cube and then a platform just before they roll off into an empty space beside the platform. The cubes represent the last block from the blockchain which are mines on average every 10 minutes. The size of the ball is determined by its size in kilobytes. These balls have designed to fall off the plate or platform so as to protect the browser of any visiting customer from crashing as a result of overload. This unique idea was made using the awesome three.js and oimo.js javascript library. The live streaming bitcoin transaction data are also gotten from blockchain.info. The current value of the total transaction, as well as the biggest, are also being displayed.